OLS Model: Diagnostics
|
We chose the OLS model based on the results of 5 tests: linearity, normality, homeskedasticity, independence, and multicollinearity. The results of each test is shown below.
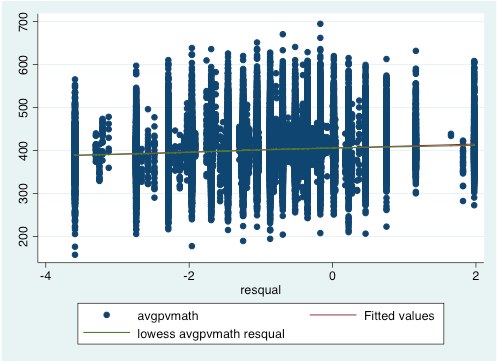
Linearity
|
|
|
The relationship between the predictors and the outcome variable is linear, thus proving linearity. |
Normality


- The Kernel density shows that the error is normally distributed, proving normality.
- The pnorm is sensitive to non-normality in the middle range of data, but it is not apparent in this graph, showing no indication of non-normality.
- The qnorm is sensitive to non-normality near the tails. This graph shows a slight deviation from normal at both tails.
Homoscedasticity
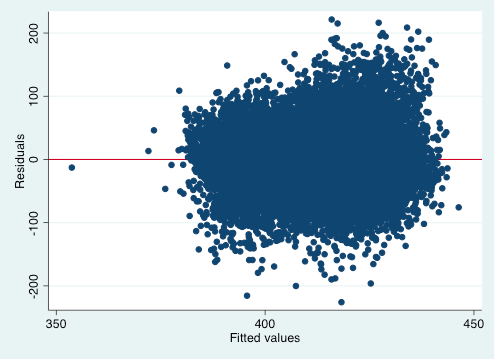
|
The test results show that our model might show some heteroskedasticity, but we do not believe it is enough to discount the OLS model. |
Independence

PISA data comes from 1367 different schools. OLS regression assumes that the residuals are independent, so we ran a regression with clustering the different schools together. The observations may be correlated within each school, but would be independent between districts. The coefficients that were significant in the OLS analysis are significant in this analysis as well.
Multicollinearity
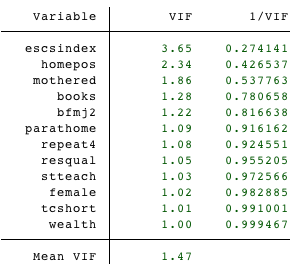
|
The VIFs look fine here, as none of the values are extremely high. If the VIF values were very high, this might indicate that certain variables are redundant. Multicollinearity arises because too many variables measure the same thing, but this is not the case in our model. |
